Day traders rely on various technical indicators to inform their decisions. One stock analysis tool some traders use to try to optimize their timing is called a moving average.
What is a moving average?
A security’s moving average is its mean price over a particular period of time. For example, a stock’s 50-day moving average is its mean price over the last 50 days, while its 200-day moving average is its mean price over the last 200 days.
Moving averages come in a few different flavors. Simple moving averages (SMAs) just use the calculation above — the average price over a set period of time. Exponential moving averages (EMAs), on the other hand, change more rapidly in response to recent price changes because they use a weighted-average formula that emphasizes more recent prices.
Moving averages change every day, hence the “moving” part. A stock’s 50-day SMA as of yesterday is its mean price over the 50 days before yesterday, while its SMA as of today is its mean price over the 50 days before today. As a result, moving averages can be drawn as lines on stock charts — and some traders look to them for buying and selling signals.
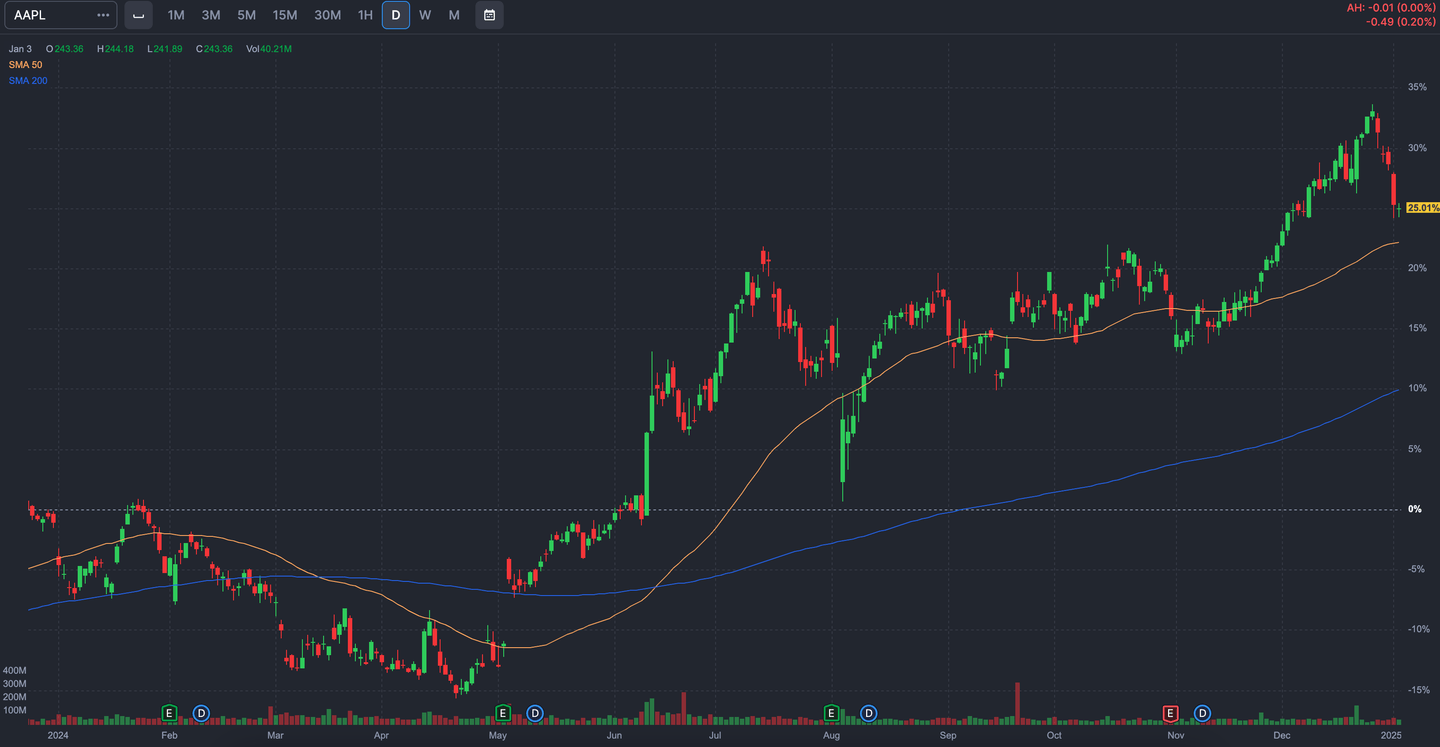
The chart below shows the price of Apple (AAPL) — one of the largest companies in the S&P 500 by market cap — in red and green candlesticks, its 50-day SMA in orange, and its 200-day SMA in blue.

Source: Finviz. Chart is current as of Jan. 3, 2025 and is intended for informational purposes only, not for trading purposes.
How do you use moving averages?
One of the simplest ways to use moving averages is to look for points where a short-term moving average intersects with a long-term moving average.
For example, if a stock’s 50-day moving average rises above its 200-day moving average, that’s called a “golden cross” and is generally considered a positive signal for the stock’s future price. You can see a golden cross on the chart above, in which Apple’s 50-day SMA crossed above its 200-day SMA in June 2024. The stock price rose significantly in the months after that cross.
Advertisement
|
NerdWallet rating
4.8 /5 |
NerdWallet rating
5.0 /5 |
NerdWallet rating
4.6 /5 |
|
Fees $0 per online equity trade |
Fees $0.005 per share; as low as $0.0005 with volume discounts |
|
|
Promotion None no promotion available at this time |
Promotion Exclusive! U.S. residents who open a new IBKR Pro account will receive a 0.25% rate reduction on margin loans. Terms apply. |
Promotion Earn up to $10,000 when you transfer your investment portfolio to Public. |
Conversely, a “death cross” is when a stock’s 50-day moving average falls below its 200-day moving average — and it’s generally considered a negative signal for the stock moving forward. The Apple chart above also shows a death cross (in March 2024) which was followed by a brief downturn in the stock’s price.
Malcolm Ethridge, a Washington, DC-area certified financial planner with CIC Wealth Management, said in an email interview that this kind of strategy can be useful for deciding when to get in and out of a stock you’ve already decided you want to buy or sell — but not for initially picking stocks.
“Technical patterns such as these are better used as a way to confirm your thesis after you’ve already decided a stock is a buy or sell,” he said.


